Engaging Plots with PyVista
Published:
An intial exploration of PyVista for interactive 3D plots, and the challenges and opportunities for interactive plots in webpages.
While I haven’t been able to embed the visualisations into the page, they are easy to download from the jupyter notebook as html files, which can then be uploaded and linked.
PyVista provides some excellent tools for 3d plotting and mesh analysis, and I am looking quite closely at it for new ways of plotting antenna patterns and sources and fields within LyceanEM.
The simplest example is a sphere without data attached.
    import pyvista as pv
    sphere = pv.Sphere()

    # long example
    plotter = pv.Plotter(notebook=True)
    plotter.add_mesh(sphere)
    plotter.show(jupyter_backend='trame')
While not easy to integrate into my current website setup, it is very easy to export a PyVista graph as a mesh, which can then be plotted in ParaView, leading to very nice visualisations.
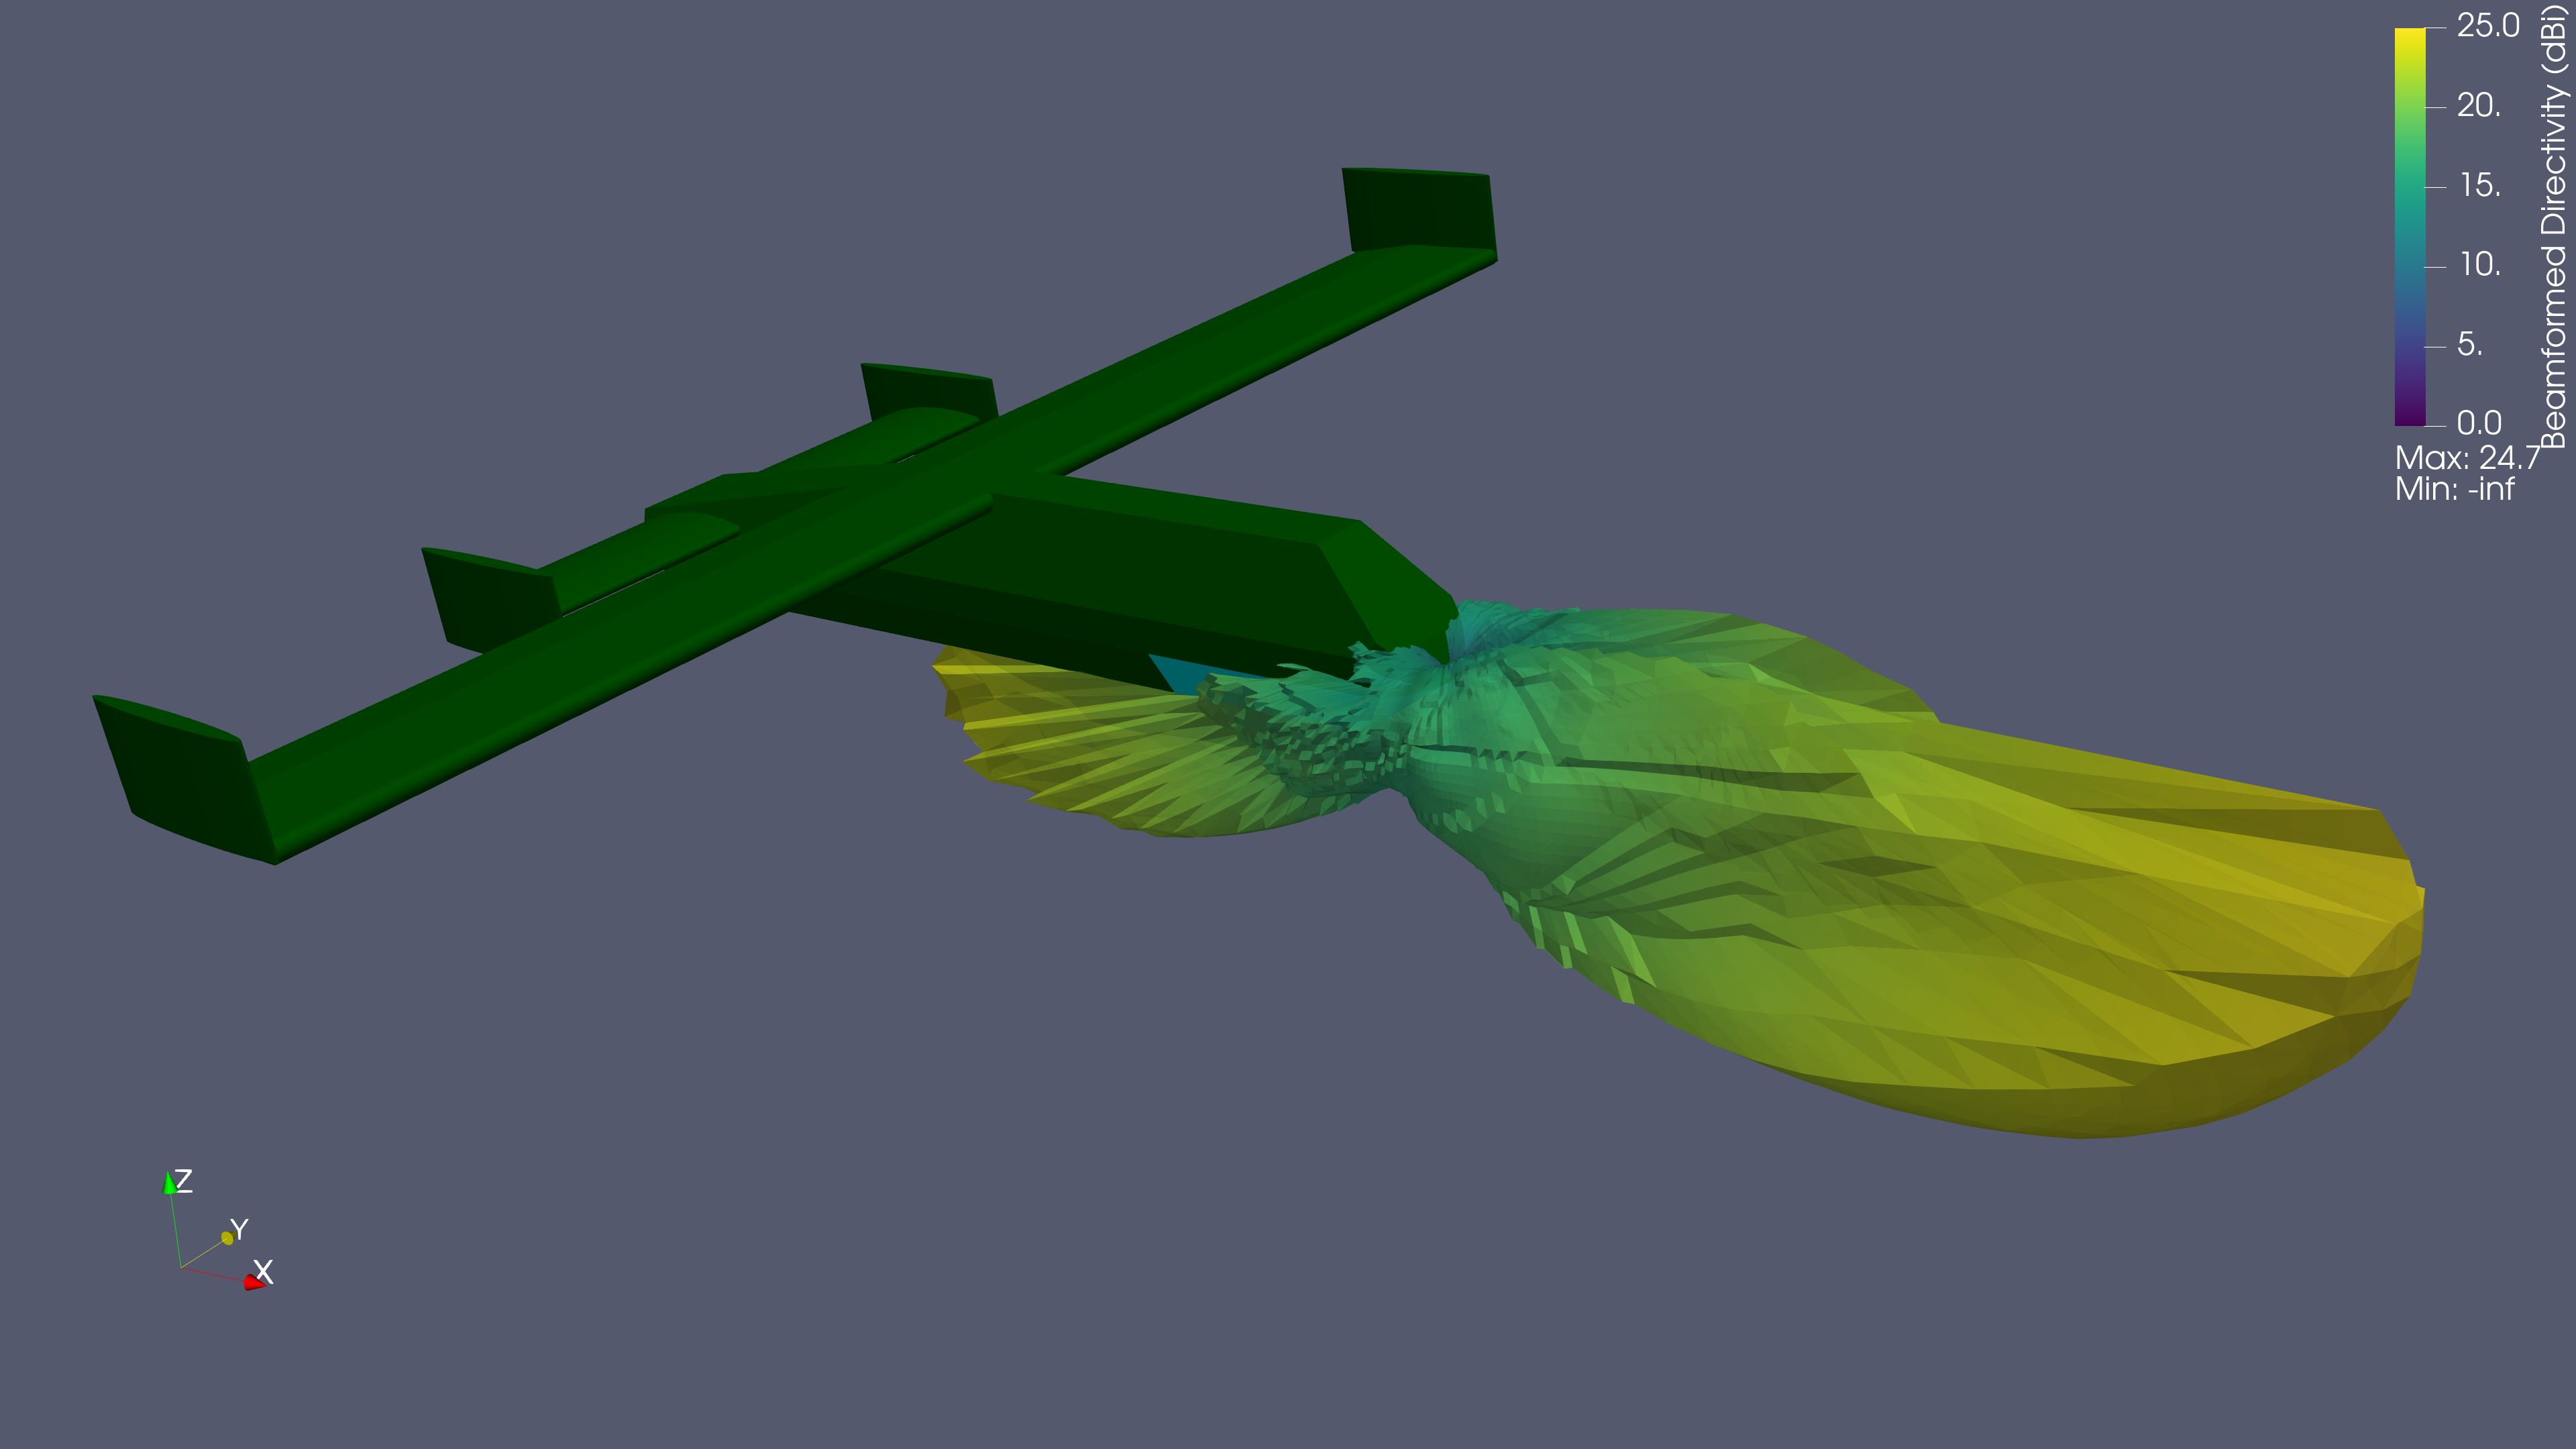
This renders nicely in Paraview, but there is no substitute for a live 3D graph. The sphere example renders within a jupyter notebook, and can be exported as an html page. However, the example drawn from LyceanEM with the 10GHz conformal antenna array can recreate the Paraview plot relatively easily, but does not export correctly as an html file. Obviously more work to be done.
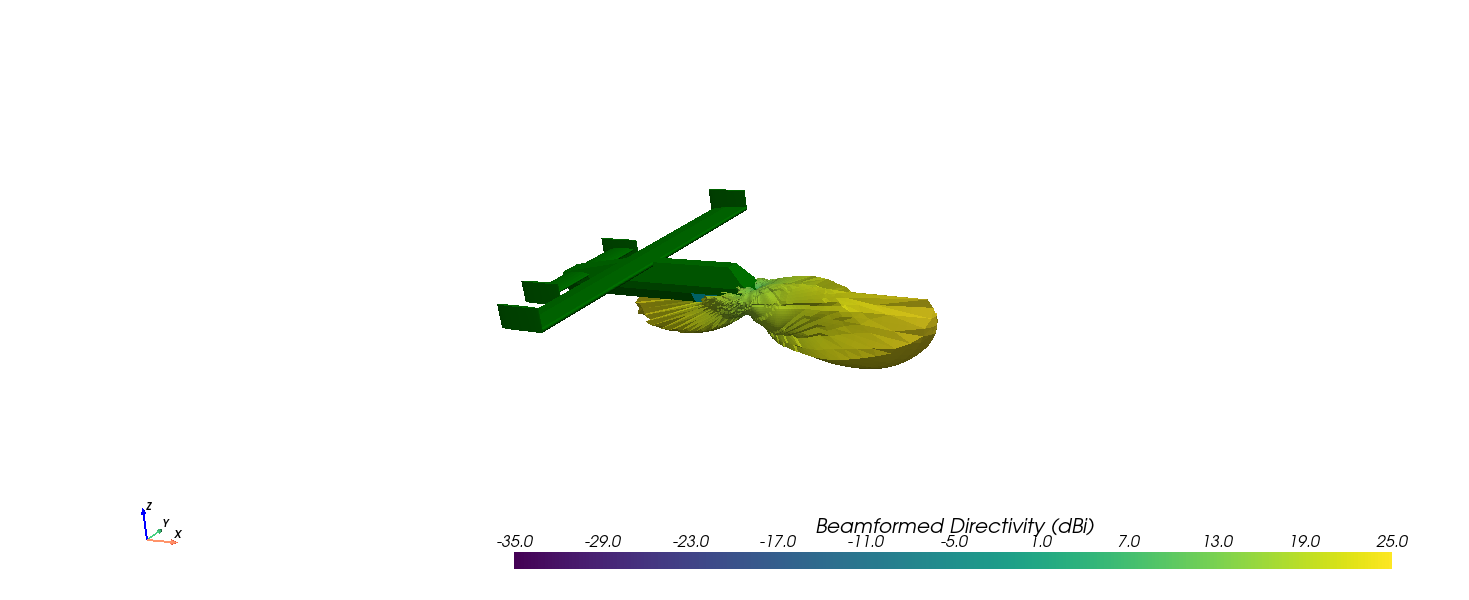
One improvement which pyvista offers is the ability to easily produce animated plots of the antenna patterns, together with the structure meshes. This allows for a very intuitive look at the changes in the antenna pattern while the command angle is varied.